
Posted by Wayne Parham [ 70.234.131.209 ] on June 05, 2008 at 17:02:52:
In Reply to: Re: Measurements posted by Akouo on June 05, 2008 at 15:56:22:
Two cents, my friend:
I agree with Akouo that your speakers sound great and the measurements will not hurt you. Fred Thompson had me make measurements of the ART array, and while he was surprised at the curve it didn't change the fact that the speakers sound great. People that expect a perfectly straight line with no blips are used to seeing highly smoothed charts. I think that's the usual case for just about anyone that doesn't make their own measurements, including even very experienced DIY'ers and audiophiles.
You can smooth your charts at 1/6th or 1/3rd octave like so many others do. That removes a lot of the blemishes from a response curve. Smoothing isn't necessarily deceptive, because a smoothed chart shows an overall shape. It's manufacturers publishing overly smoothed charts that annoy me, or comparing unsmoothed charts to smoothed ones and not explaining the difference. Those things are a little deceptive. But just applying a 1/6th octave smoothing isn't.
Besides, you have all you need to make good looking polar charts. LMS is really slick at making polars. Just make several sweeps at equally spaced angles and store them, click on the button to make 'em polars and voila! You can also simply overlay several curves on a standard amplitude response graph, each taken at a different angle.
As an example, here are 90° polars of the π wood horn with Eminence PSD2002 driver. Click on them to see a bigger picture. You can do the same thing with your speaker and they'll look great. That's one of the best things about LMS. Its reliability and consistency is another.
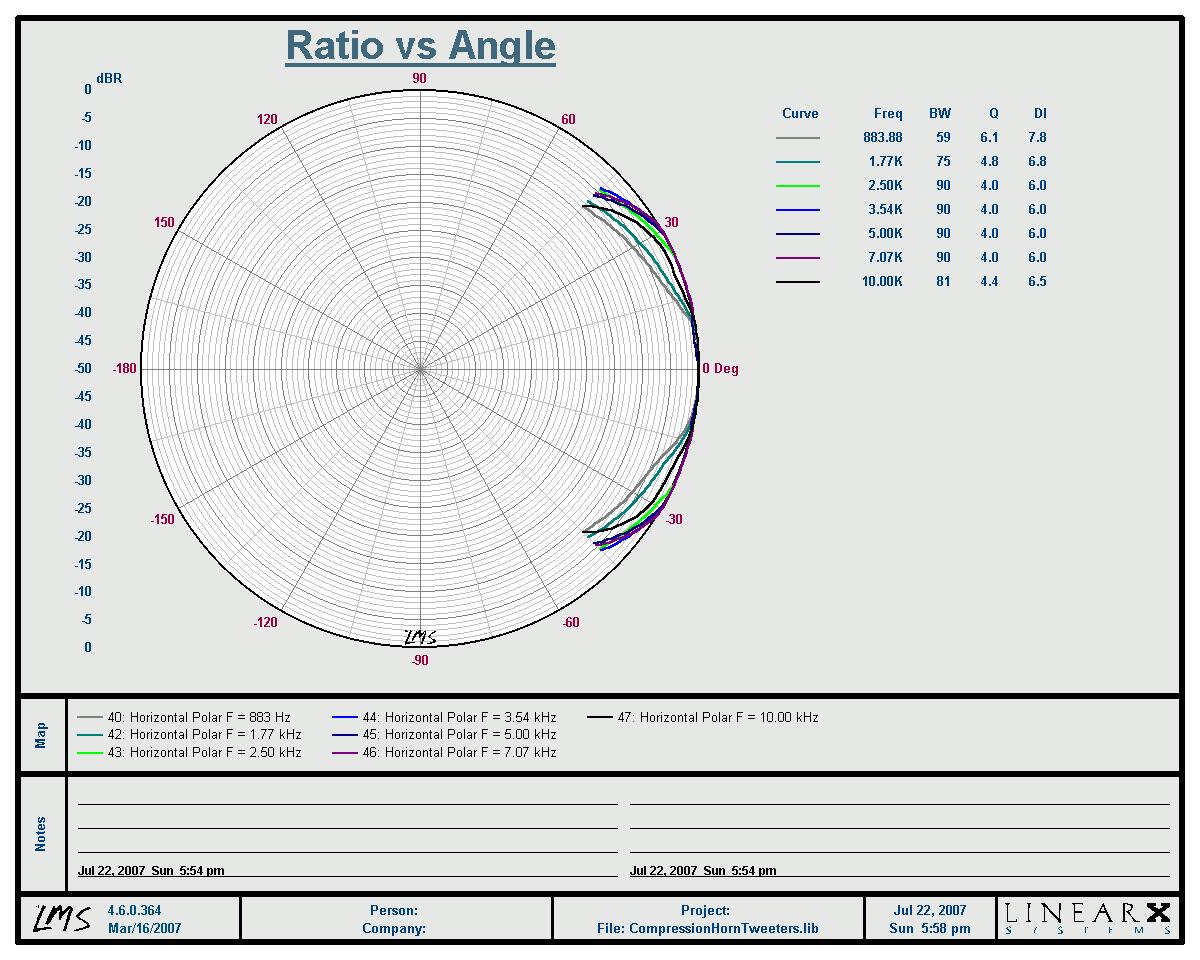 Horizontal Polar Plot | 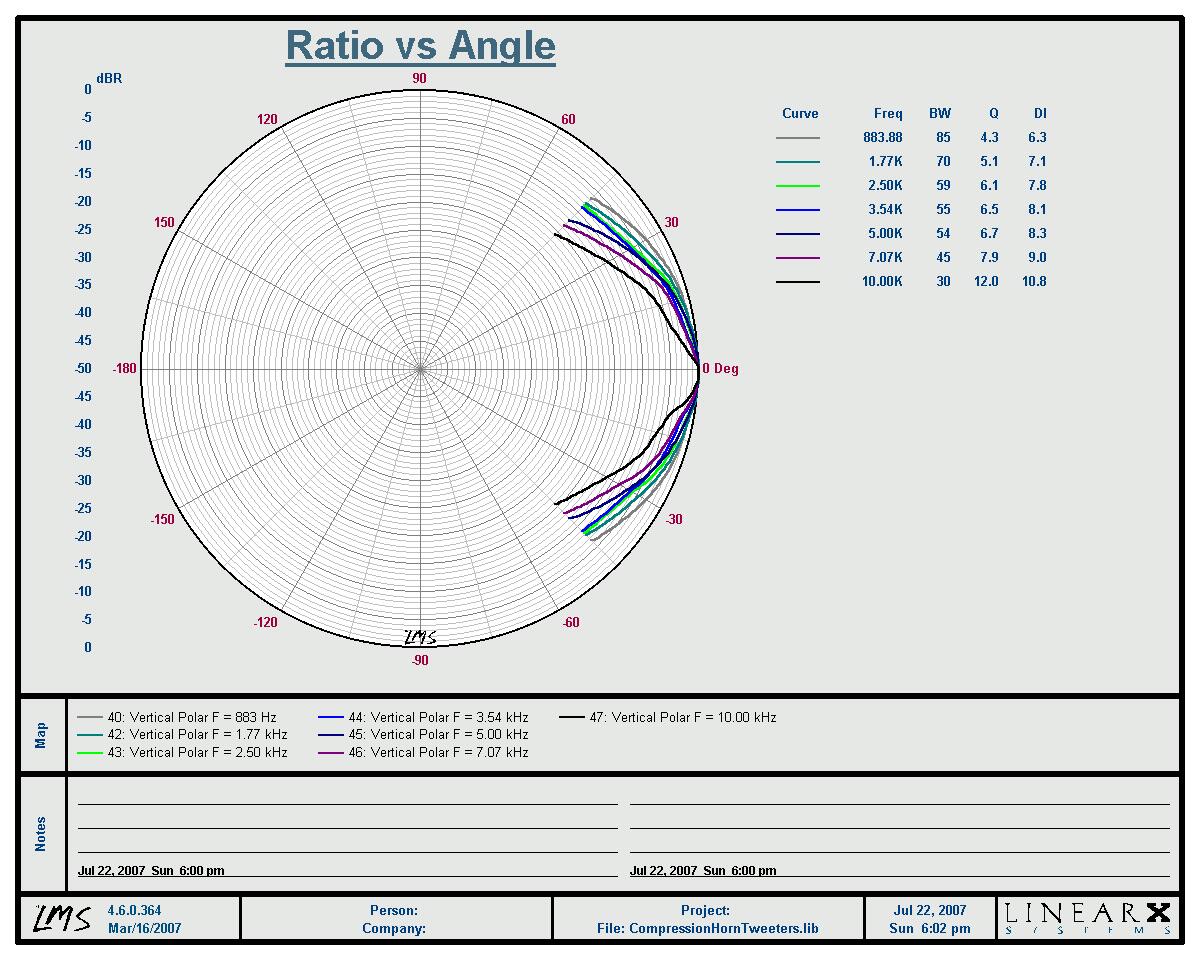 Vertical Polar Plot |
[ AudioKinesis Forum ] [ Help ]